Clustering 3 Jetson Orin Nano Super
Build a 3-node Jetson Orin Nano Super 8GB cluster with active cooling. Real numbers: ~759 Mbps per link (gigabit), peak 58.3°C across all 3 nodes under full 18-core sustained load, zero throttling at 1728 MHz throughout.
Tested on: NVIDIA Jetson Orin Nano 8GB Developer Kit, Ubuntu 22.04.5 LTS, kernel 5.15.148-tegra, L4T R36.4.7, CUDA 12.6, TP-Link TL-SG108E gigabit switch JetPack: R36 (release), REVISION: 4.7, CUDA 12.6, Driver 540.4.0
You have three Jetson Orin Nanos. Each has a 6-core ARM Cortex-A78 CPU, an Ampere GPU with CUDA 12.6, and 8GB LPDDR5. This is real GPU compute at the edge. Not a toy..
This guide walks you through setting up a real 3-node Jetson Orin Nano cluster. Real measured numbers from this exact hardware: ~759 Mbps per link (gigabit), peak 58.3°C across all 3 nodes under full 18-core sustained load, zero throttling at 1728 MHz throughout. Stable, thermally managed, and ready for CUDA-accelerated distributed inference.
By the end, your Nanos will boot, talk to each other with <2ms latency, and be ready for inference workloads across all 3 nodes.
Why This Setup?
- Real GPU compute on every node. Each Orin Nano has a 1024-core Ampere GPU and CUDA 12.6 built in. Not CPU-only edge boxes.
- Active cooling keeps temps in check. Under full 18-core sustained load across all 3 nodes, temps plateau at ~60°C, 35°C below the the 95°C throttle threshold.
- MAXN_SUPER mode unlocks full performance. Set
nvpmodel -m 2andjetson_clockson each node. Clocks pin at 1728 MHz CPU / 1020 MHz GPU. - Simple network. One unmanaged switch. Star topology. All nodes at <2ms latency.
The Hardware
| Component | Model | Notes |
|---|---|---|
| Nodes | 3x NVIDIA Jetson Orin Nano 8GB Developer Kit | 6x ARM Cortex-A78 @ 1728 MHz, 1024-core Ampere GPU @ 1020 MHz, 8GB LPDDR5 |
| Switch | TP-Link TL-SG108E | 8-port unmanaged gigabit switch, plug & play |
| Power | 19V DC power adapter (included with dev kit) | Included in the box; use only the provided adapter |
| Cables | Cat 6–Cat 8 Ethernet (×3) | Any Cat 6+ works |
| Storage | microSD 128GB (×3) or NVMe SSD | JetPack + CUDA libs + models fill space fast; NVMe is faster |
| Cooling | Active fan (included with dev kit) | Required; do not run cluster workloads fanless |
| Case | 52Pi Raspberry Pi Cluster Case with 120mm RGB LED 5V Fan | Acrylic cluster enclosure with active 120mm top fan; fits the Orin Nano carrier boards with standard standoff spacing |
Real Performance Expectations
Numbers measured on this exact hardware:
- Throughput (measured, gigabit):
- nano-3→nano-1: 770 Mbps
- nano-3→nano-2: 759 Mbps
- nano-1→nano-2: 750 Mbps.
Both nodes sending simultaneously from nano-3: 391 + 365 Mbps (nano-3 NIC saturated at ~756 Mbps total).
- Latency: <2ms between nodes on the local switch. Measured: 0.5–1.3ms in real ping tests.
- Thermals, single node (5-min stress, fan running):
- Idle: ~50°C CPU / 49°C GPU
- 1-core load: peak 55.2°C, stabilises 54–55°C, 1728 MHz throughout
- All 6 cores: peak 60.4°C, stabilises 59–60°C, 1728 MHz throughout
- Thermals, full cluster (18 cores across all 3 nodes, 10-min stress, measured on each node):
- nano-1 peak: 57.0°C
- nano-2 peak: 55.5°C
- nano-3 peak: 58.3°C CPU / 56.8°C GPU
- All nodes held 1728 MHz for the full 10 minutes. Zero throttling.
- 95°C throttle threshold gives ~37°C headroom at peak cluster load.
- GPU: 1024-core Ampere @ 1020 MHz (MAXN_SUPER + jetson_clocks). CUDA 12.6, cuDNN 9.x, TensorRT 10.x.
Perfect for:
- Distributed GPU inference (split model or batch across nodes)
- CUDA-accelerated preprocessing / ETL
- Edge AI that runs entirely on-device
- Learning how distributed GPU systems work
Not good for:
- High-bandwidth inter-node gradient sync at scale since these are linked via 100 Mbps Ethernet. For distributed training, consider a cluster with a 10 Gbps switch or direct NVLink connections.
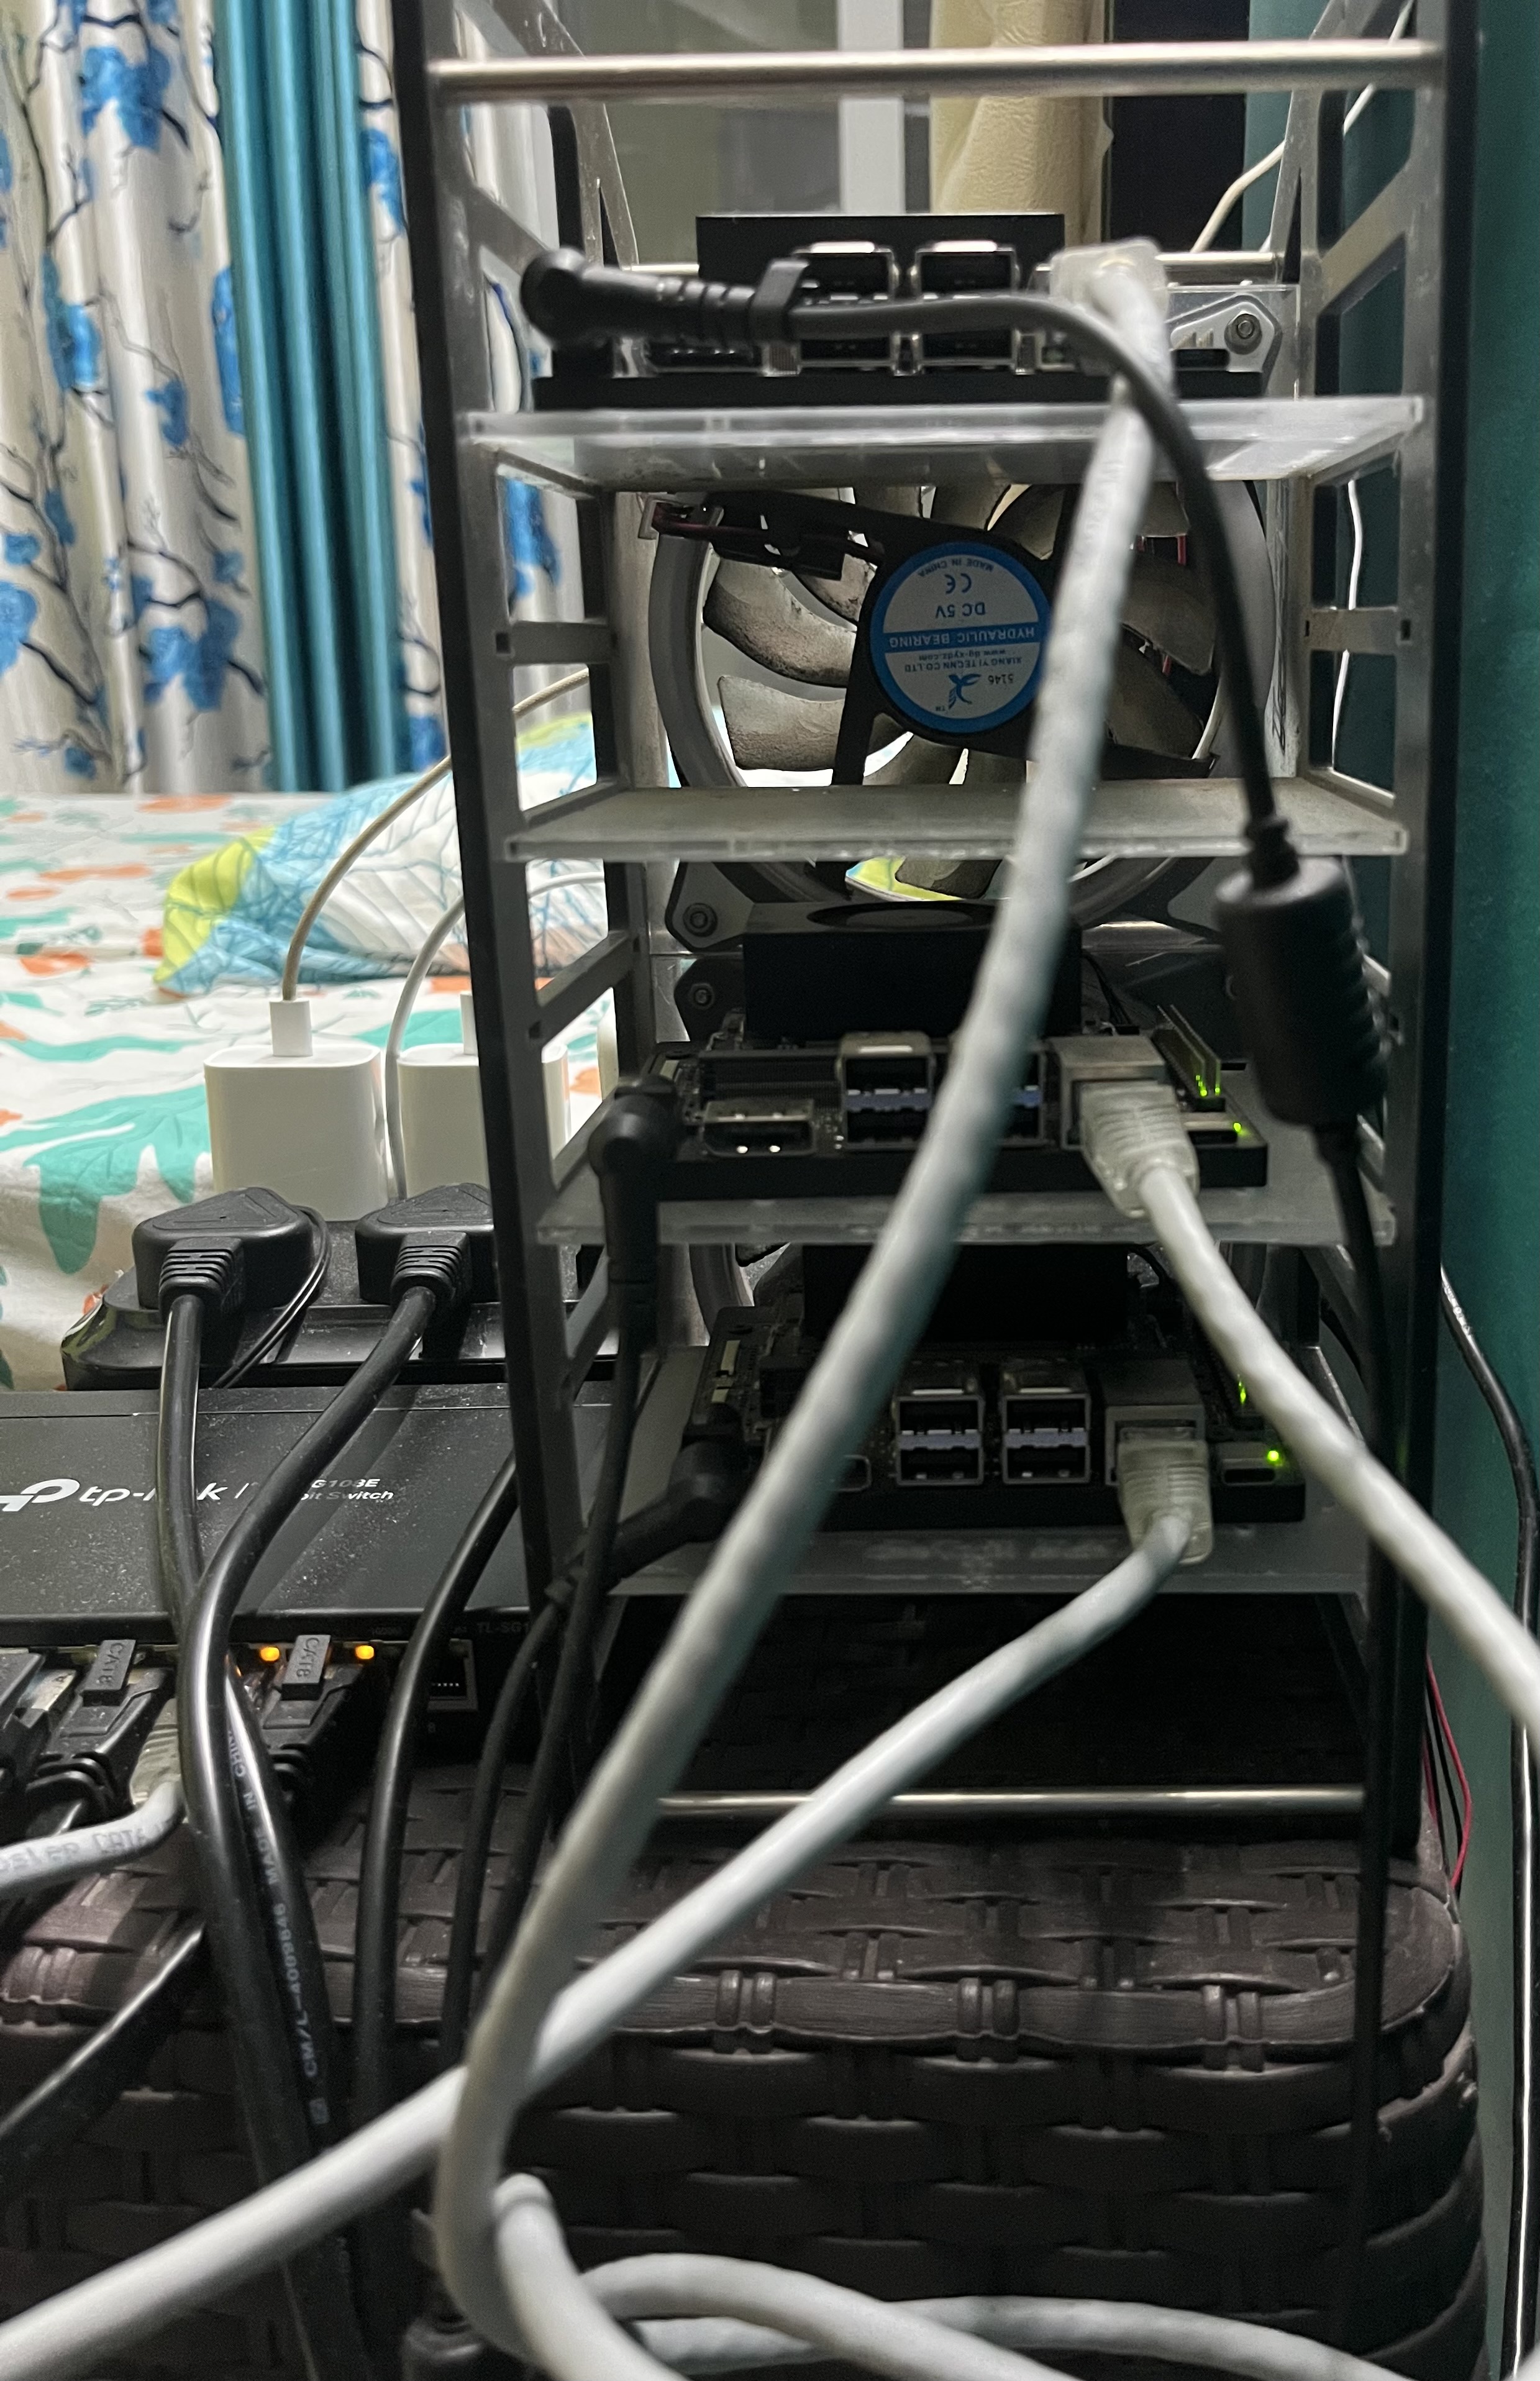
Step 1: Assemble the Hardware
Start with the case. Follow the 52Pi cluster case user manual to assemble the acrylic layers and mount the standoffs before touching the Jetson boardssince it’s much easier to build the frame empty than to retrofit boards into it later.
Once the frame is built, seat each Orin Nano carrier board into its layer using the standoffs provided in the 52Pi kit, then connect the 120mm 5V RGB fan header to an available 5V GPIO or fan pin as shown in the manual. The case fan handles ambient airflow across all three nodes; the per-board fan on each Orin Nano still handles direct SoC cooling and must remain connected.
SoC or a system on a chip is where all the CPU, GPU ,memory, and other components are integrated into a single chip. The fan on the Orin Nano carrier board cools this critical component directly, while the case fan circulates air around the whole cluster.
The Orin Nano Developer Kit ships with a 19V power adapter. Connect it to the barrel jack on the carrier board. The board powers on automatically when connected. No power button is required to be pressed.
Make sure each node’s fan is connected. The developer kit includes an active fan and it is mandatory for sustained workloads; connect it to the fan header on the carrier board before first boot.
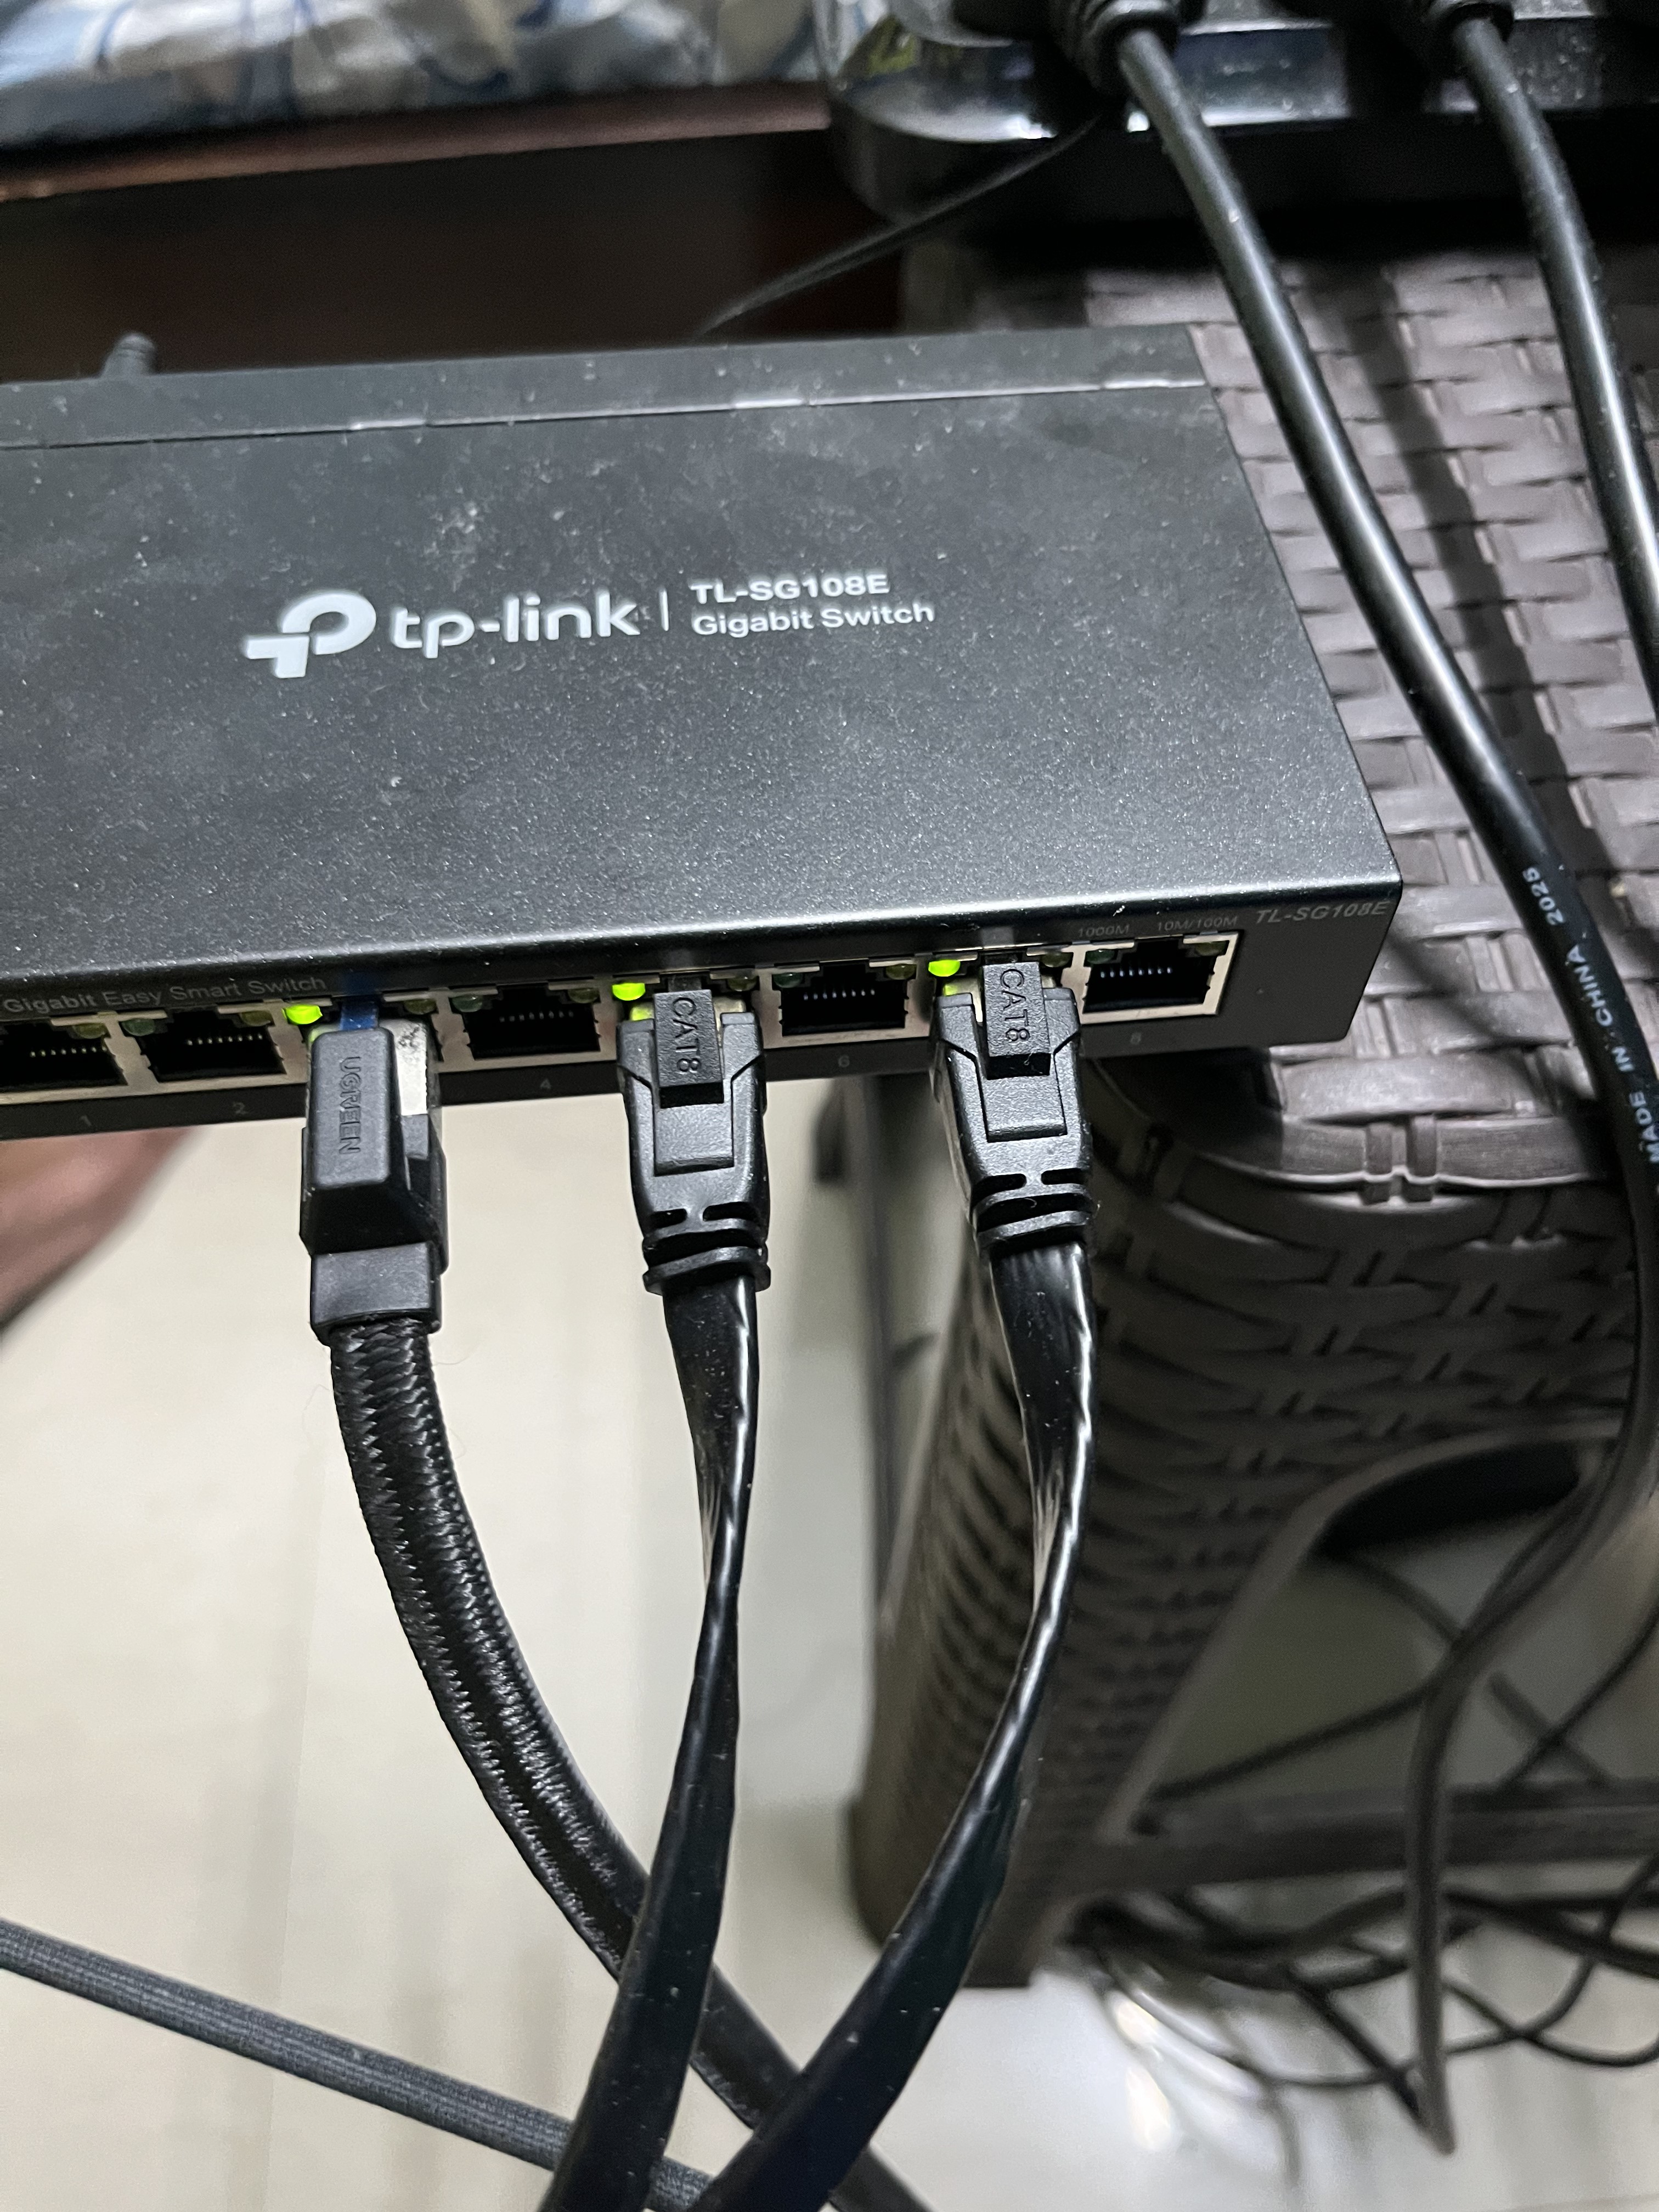
Connect each Orin Nano to the TL-SG108E switch via Cat 6 Ethernet:
nano-1 ──── Cat6 ──── TP-Link TL-SG108E port 1
nano-2 ──── Cat6 ──── TP-Link TL-SG108E port 2
nano-3 ──── Cat6 ──── TP-Link TL-SG108E port 3
Plug the switch into power. Wait 30 seconds for it to initialise.
Step 2: Install JetPack & First Boot
Follow the NVIDIA Jetson Orin Nano Developer Kit Quick Start Guide to get each node booted and set up.
Two things to set consistently across all 3 nodes during setup:
- Username: same on every node (e.g.
yuvrajsingh) - Hostname:
nano-1,nano-2,nano-3
After the wizard, enable SSH on each node:
sudo systemctl enable --now ssh
Then set max performance mode. Default after install is 25W; switch to MAXN_SUPER:
sudo nvpmodel -m 2
Disconnect the monitor/keyboard. Everything from here is headless.
Step 4: Find Your IP Addresses
SSH into nano-1:
ssh yuvrajsingh@nano-1.local
Find the IP:
hostname -I
Output (example):
192.168.1.11 172.17.0.1
The first address is your LAN IP. Ignore 172.17.0.1 (Docker’s bridge). Repeat for all 3 Nanos.
Example IPs (yours will differ):
nano-1: 192.168.1.11
nano-2: 192.168.1.12
nano-3: 192.168.1.13
Write these down. You need them for the next step.
Step 4b: Assign Private Subnet IPs (Recommended)
Why? A private subnet gives each Nano a stable, predictable address you control, isolates all cluster traffic to a known range, and makes SSH config, scripts, and inter-node communication unambiguous.
We’ll add a static secondary IP on 10.10.1.x/24 to each Nano’s eth0 alongside the existing DHCP address.
SSH into each Nano using its DHCP IP:
ssh yuvrajsingh@192.168.1.11 # nano-1
Check the NetworkManager connection name:
nmcli connection show
Output:
NAME                UUID                                  TYPE      DEVICE
Wired connection 1  a1b2c3d4-...                          ethernet  eth0
Add the static private IP:
# On nano-1:
sudo nmcli connection modify "Wired connection 1" +ipv4.addresses "10.10.1.1/24"
sudo nmcli connection up "Wired connection 1"
Verify:
ip addr show eth0
Expected:
2: eth0: <BROADCAST,MULTICAST,UP,LOWER_UP> ...
    inet 192.168.1.11/24 brd 192.168.1.255 scope global dynamic noprefixroute eth0
    inet 10.10.1.1/24 brd 10.10.1.255 scope global noprefixroute eth0
Repeat on all 3 Nanos:
| Node | DHCP IP (Step 4) | Private IP to assign |
|---|---|---|
| nano-1 | 192.168.1.11 | 10.10.1.1 |
| nano-2 | 192.168.1.12 | 10.10.1.2 |
| nano-3 | 192.168.1.13 | 10.10.1.3 |
From here on, all steps use 10.10.1.x IPs.
Step 5: Test All 3 Nodes Ping Each Other
From your laptop:
ping 10.10.1.1
ping 10.10.1.2
ping 10.10.1.3
5a: SSH into nano-1 and ping the other nodes
ssh yuvrajsingh@10.10.1.1
From there:
ping 10.10.1.2
ping 10.10.1.3
Expected output:
PING 10.10.1.2 (10.10.1.2) 56(84) bytes of data.
64 bytes from 10.10.1.2: icmp_seq=1 ttl=64 time=0.633 ms
64 bytes from 10.10.1.2: icmp_seq=2 ttl=64 time=0.477 ms
Measured on this hardware: 0.5–1.3ms between nodes. All working? Move on.
Step 6: Set Up SSH Keys
Generate a key on your laptop (or any node you want to connect from):
ssh-keygen -t ed25519 -f ~/.ssh/nano_cluster -N ""
The -N "" skips the passphrase prompt, needed for passwordless SSH to work smoothly. You’ll see:
Generating public/private ed25519 key pair.
Your identification has been saved in /home/yuvrajsingh/.ssh/nano_cluster
Your public key has been saved in /home/yuvrajsingh/.ssh/nano_cluster.pub
The key fingerprint is:
SHA256:ej69Uum+V2f0xsSXr8/hZjqhGwuvEi/UehbtTqc5iSE yuvrajsingh@nano-3
The key's randomart image is:
+--[ED25519 256]--+
|                 |
|               ..|
|        S ..   ++|
|       E +o. .. B|
|      o *==ooo.* |
|       *o=*=B.o+.|
+----[SHA256]-----+
Pre-add the other nodes’ host keys to skip the fingerprint prompt on first connect:
ssh-keyscan -H 10.10.1.1 10.10.1.2 >> ~/.ssh/known_hosts
Copy the key to all nodes:
ssh-copy-id -i ~/.ssh/nano_cluster.pub yuvrajsingh@10.10.1.1
ssh-copy-id -i ~/.ssh/nano_cluster.pub yuvrajsingh@10.10.1.2
ssh-copy-id -i ~/.ssh/nano_cluster.pub yuvrajsingh@10.10.1.3
Each will ask for the node’s password once, then show:
/usr/bin/ssh-copy-id: INFO: attempting to log in with the new key(s), to filter out any that are already installed
/usr/bin/ssh-copy-id: INFO: 1 key(s) remain to be installed -- if you are prompted now it is to install the new keys
yuvrajsingh@10.10.1.1's password:

Number of key(s) added: 1

Now try logging into the machine, with:   "ssh 'yuvrajsingh@10.10.1.1'"
and check to make sure that only the key(s) you wanted were added.
Test passwordless login:
ssh -i ~/.ssh/nano_cluster yuvrajsingh@10.10.1.1
No password prompt. Type exit.
Step 7: Create SSH Config
Append to ~/.ssh/config:
cat >> ~/.ssh/config << 'EOF'

Host nano-1
    HostName 10.10.1.1
    User yuvrajsingh
    IdentityFile ~/.ssh/nano_cluster
    IdentitiesOnly yes

Host nano-2
    HostName 10.10.1.2
    User yuvrajsingh
    IdentityFile ~/.ssh/nano_cluster
    IdentitiesOnly yes

Host nano-3
    HostName 10.10.1.3
    User yuvrajsingh
    IdentityFile ~/.ssh/nano_cluster
    IdentitiesOnly yes
EOF
Test the shortcuts:
ssh nano-1
You’ll see:
Welcome to Ubuntu 22.04.5 LTS (GNU/Linux 5.15.148-tegra aarch64)
...
yuvrajsingh@yuvrajsingh-jetson-nano1:~$
No password. Type exit and repeat for nano-2 and nano-3.
Step 8: Update & Set Performance Mode
Update the OS
ssh nano-1
sudo apt update && sudo apt upgrade -y
sudo reboot
Wait 30 seconds, repeat for nano-2 and nano-3.
Set MAXN_SUPER Performance Mode
By default, Orin Nano may boot in a lower power mode. The available modes on this hardware:
| Mode ID | Name | Notes |
|---|---|---|
| 0 | 15W | Moderate performance |
| 1 | 25W | High performance |
| 2 | MAXN_SUPER | Maximum (use this) |
| 3 | 7W | Low power |
Switch to MAXN_SUPER (mode 2) on each node:
sudo nvpmodel -m 2
Verify:
nvpmodel -q
Expected:
NV Power Mode: MAXN_SUPER
2
Lock all clocks to maximum:
sudo jetson_clocks
Verify:
sudo jetson_clocks --show
GPU should show MinFreq=1020000000 MaxFreq=1020000000 CurrentFreq=1020000000. CPU should be at 1728 MHz.
Check current CPU freq:
cat /sys/devices/system/cpu/cpu0/cpufreq/scaling_cur_freq
Expected: 1728000 (1728 MHz).
Install Python and Tools
sudo apt install -y python3-pip python3-venv python3-dev git htop
Install jtop, interactive monitoring for Jetson (GPU, CPU, temps, CUDA all in one):
sudo pip3 install jetson-stats
sudo systemctl restart jtop.service
Run with: sudo jtop
Create a venv:
python3 -m venv ~/cluster_env
source ~/cluster_env/bin/activate
Repeat on all 3 Nanos.
Step 9: Test Bandwidth
Real throughput test between nodes using iperf3.
Install on all Nanos:
sudo apt install -y iperf3
On nano-1, start the server:
ssh nano-1
iperf3 -s
-----------------------------------------------------------
Server listening on 5201
-----------------------------------------------------------
On nano-3, run the client against nano-1:
iperf3 -c 10.10.1.1 -t 20 -f m
Actual output from this hardware:
Connecting to host 10.10.1.1, port 5201
[  5] local 10.10.1.3 port 56890 connected to 10.10.1.1 port 5201
[ ID] Interval           Transfer     Bitrate         Retr  Cwnd
[  5]   0.00-20.00  sec  1.79 GBytes   770 Mbits/sec    0             sender
[  5]   0.00-20.04  sec  1.79 GBytes   766 Mbits/sec                  receiver
770 Mbps, real gigabit. Consistent across all three node pairs.
Bandwidth table (all numbers measured on this hardware)
| Scenario | Throughput | Notes |
|---|---|---|
| nano-3 → nano-1 (single link) | 770 Mbps | Gigabit link |
| nano-3 → nano-2 (single link) | 759 Mbps | Consistent across all pairs |
| nano-1 → nano-2 (single link) | 750 Mbps | All three pairs within 20 Mbps of each other |
| nano-3 → nano-1 AND nano-3 → nano-2 simultaneously | 391 + 365 Mbps | nano-3 NIC saturated (~756 Mbps total) |
| All-to-all (nano-1→nano-2, nano-2→nano-3, nano-3→nano-1 simultaneously) | 709 / 693 / 695 Mbps | Each node sustaining ~700 Mbps while simultaneously receiving |
Latency matrix (all 6 pairs pinged concurrently, 20 packets each)
| Pair | Min (ms) | Avg (ms) | Max (ms) | Packet Loss |
|---|---|---|---|---|
| nano-3 → nano-1 | 0.442 | 0.828 | 1.264 | 0% |
| nano-3 → nano-2 | 0.426 | 0.562 | 0.748 | 0% |
| nano-1 → nano-2 | 0.219 | 0.530 | 1.039 | 0% |
| nano-1 → nano-3 | 0.298 | 0.670 | 1.160 | 0% |
| nano-2 → nano-1 | 0.285 | 0.509 | 1.063 | 0% |
| nano-2 → nano-3 | 0.239 | 0.440 | 0.950 | 0% |
Sub-millisecond average latency across all pairs under concurrent load. Zero packet loss.
For full commands and monitoring procedure, see Appendix B: Cluster Test Commands.
Step 11: Test Temperatures
Install stress-ng:
sudo apt install -y stress-ng
Check baseline temperature:
for zone in cpu-thermal gpu-thermal; do
  idx=$(grep -rl "^${zone}$" /sys/class/thermal/thermal_zone*/type | grep -o '[0-9]*' | tail -1)
  temp=$(cat /sys/class/thermal/thermal_zone${idx}/temp)
  printf "%-20s %.1f°C\n" "$zone" "$(echo $temp | awk '{print $1/1000}')"
done
Or use tegrastats for a full readout:
sudo tegrastats --interval 1000
Output includes CPU@XX.XC and GPU@XX.XC fields.
Idle on this hardware (fan running): ~50°C CPU, ~49°C GPU.
Test 1: Single Core at 100% (5 min)
stress-ng --cpu 1 --timeout 300s
Monitor in another terminal:
watch -n 5 'cat /sys/class/thermal/thermal_zone0/temp | awk "{printf \"CPU: %.1f°C\n\", \$1/1000}"'
Results on this hardware:
| Time (s) | CPU (°C) | GPU (°C) | Freq (MHz) |
|---|---|---|---|
| 0 | 52.0 | 52.1 | 1728 |
| 30 | 53.0 | 52.7 | 1728 |
| 60 | 53.4 | 53.6 | 1728 |
| 120 | 54.7 | 54.1 | 1728 |
| 300 | 54.8 | 54.8 | 1728 |
Result: Peaks at 55.2°C, stabilises at 54–55°C. Zero throttling. 1728 MHz throughout.
For commands and monitoring procedure, see Appendix A: Single Node Test Commands.
Test 2: All 6 Cores at 100% (5 min)
stress-ng --cpu 6 --timeout 300s
Results on this hardware:
| Time (s) | CPU (°C) | GPU (°C) | Freq (MHz) |
|---|---|---|---|
| 0 | 53.9 | 54.1 | 1728 |
| 30 | 57.7 | 56.2 | 1728 |
| 60 | 58.4 | 57.0 | 1728 |
| 120 | 59.6 | 58.6 | 1728 |
| 300 | 60.4 | 59.0 | 1728 |
Result: Ramp +6.5°C in first 30s, cooling catches up within 60s. Plateaus at 59–60.4°C. Zero throttling.
For commands and monitoring procedure, see Appendix A: Single Node Test Commands.
Test 3: Full Cluster 18 Cores at 100% (10 min)
Run on all 3 Nanos simultaneously. Use SSH to start stress on the remote nodes while running locally; keep the SSH sessions alive in the foreground so the processes don’t die when the connection closes:
ssh nano-1 "stress-ng --cpu 6 --timeout 600s" &
ssh nano-2 "stress-ng --cpu 6 --timeout 600s" &
stress-ng --cpu 6 --timeout 600s &
wait
Measured from each node simultaneously:
| Min | nano-1 (°C) | nano-2 (°C) | nano-3 CPU (°C) | nano-3 GPU (°C) | Freq (MHz) |
|---|---|---|---|---|---|
| 0 (baseline) | 54.5 | 54.0 | 54.4 | 54.4 | 1728 |
| 1 | 56.2 | 54.6 | 57.2 | 55.8 | 1728 |
| 2 | 56.4 | 54.9 | 57.5 | 56.4 | 1728 |
| 3 | 56.5 | 54.7 | 57.8 | 56.1 | 1728 |
| 5 | 56.8 | 55.3 | 57.8 | 56.3 | 1728 |
| 7 | 56.9 | 54.9 | 57.9 | 56.5 | 1728 |
| 10 | 55.2 | 54.3 | 55.0 | 54.7 | cooling |
Result: nano-1 peaked at 57.0°C, nano-2 at 55.5°C, nano-3 at 58.3°C CPU / 56.8°C GPU. All 3 nodes held 1728 MHz for the full 10 minutes. Zero throttling. 37°C headroom before the 95°C Orin throttle threshold.
For full commands and live monitoring procedure, see Appendix B: Cluster Test Commands.
After the test, verify clocks are still at max:
cat /sys/devices/system/cpu/cpu0/cpufreq/scaling_cur_freq
Expected: 1728000
nvpmodel -q
Expected: MAXN_SUPER / 2
Test 4: Full Cluster GPU Burn (5 min, all 3 nodes)
Install gpu-burn, the standard CUDA GPU stress tool:
git clone https://github.com/wilicc/gpu-burn
cd gpu-burn && make
Run on all 3 nodes simultaneously (copy the binary to each node first via scp):
ssh nano-1 "cd /tmp && ./gpu_burn 300" &
ssh nano-2 "cd /tmp && ./gpu_burn 300" &
./gpu_burn 300 &
wait
Results on this hardware:
| Time | nano-1 CPU | nano-1 GPU | nano-2 CPU | nano-2 GPU | nano-3 CPU | nano-3 GPU | CPU Freq |
|---|---|---|---|---|---|---|---|
| 0 (baseline) | 49.2°C | 51.1°C | 49.2°C | 50.6°C | 48.5°C | 48.3°C | 1728 MHz |
| 1m | 49.2°C | 50.9°C | 49.1°C | 50.5°C | 48.5°C | 48.5°C | 1114 MHz |
| 3m | 49.8°C | 51.3°C | 49.2°C | 50.9°C | 48.2°C | 48.4°C | 1114 MHz |
| 5m | 49.9°C | 51.3°C | 49.1°C | 50.5°C | 48.5°C | 48.9°C | 1190 MHz |
Result: GPU temps peaked at 51.3°C, barely above idle. CPU temps unchanged. CPU frequency dropped from 1728 to ~1114–1190 MHz because the GPU workload draws from the shared power budget in MAXN_SUPER mode. Zero GPU throttling (95°C threshold gives ~44°C headroom).
For full commands and monitoring procedure, see Appendix B: Cluster Test Commands.
Thermal Summary
| Scenario | Nodes | Peak CPU | Peak GPU | Throttled? | CPU Clock |
|---|---|---|---|---|---|
| Idle | all 3 | ~50°C | ~49°C | No | 1728 MHz |
| 1 core CPU stress, 5 min | nano-3 only | 55.2°C | 54.8°C | No | 1728 MHz |
| All 6 cores CPU stress, 5 min | nano-3 only | 60.4°C | 59.1°C | No | 1728 MHz |
| Full cluster 18 cores CPU stress, 10 min | all 3 | 58.3°C | 56.8°C | No | 1728 MHz |
| Full cluster GPU burn (gpu-burn), 5 min | all 3 | 49.9°C | 51.3°C | No | ~1114–1190 MHz |
Key finding: The Ampere GPU runs remarkably cool under full compute load. CPU stress is the thermal ceiling for this cluster at 58.3°C, still 37°C from the 95°C throttle threshold.
Step 12: Test Inter-Node SSH (for distributed jobs)
From nano-1, SSH to nano-2 without a password:
ssh nano-1
ssh yuvrajsingh@10.10.1.2
If it asks for a password, set up keys between the Nanos:
On nano-1:
ssh-keygen -t ed25519
# Press Enter for all defaults
ssh-copy-id -i ~/.ssh/id_ed25519.pub yuvrajsingh@10.10.1.2
ssh-copy-id -i ~/.ssh/id_ed25519.pub yuvrajsingh@10.10.1.3
Retry:
ssh yuvrajsingh@10.10.1.2
Works now. Repeat from each Nano to all others. Distributed frameworks (Ray, MPI) need passwordless SSH between all node pairs.
Debugging Commands
| What to Check | Command |
|---|---|
| All temps (live) | sudo tegrastats --interval 1000 |
| CPU temp (quick) | cat /sys/class/thermal/thermal_zone0/temp \| awk '{printf "%.1f°C\n", $1/1000}' |
| GPU temp | cat /sys/class/thermal/thermal_zone1/temp \| awk '{printf "%.1f°C\n", $1/1000}' |
| Performance mode | nvpmodel -q |
| All clock settings | sudo jetson_clocks --show |
| CPU frequencies (all cores) | cat /sys/devices/system/cpu/cpu*/cpufreq/scaling_cur_freq |
| GPU frequency | cat /sys/devices/platform/gpu.0/devfreq/*/cur_freq |
| Full system monitor | sudo jtop |
| Ethernet link speed | ethtool enP8p1s0 \| grep Speed |
| IP addresses | hostname -I |
| Memory | free -h |
| Disk | df -h |
| Ping another node | ping 10.10.1.2 -c 3 |
| Bandwidth test (server) | iperf3 -s |
| Bandwidth test (client) | iperf3 -c <ip> -t 20 -f m |
Common Issues
“Bandwidth is only ~94 Mbps instead of ~940 Mbps”
The TL-SG108E has no physical DIP switches or buttons. Unlike the LS110P which had an Extend Mode DIP switch on the bottom, the SG108E is managed entirely through its web interface. A port manually set to 100 Mbps there will stay at 100 Mbps regardless of cable quality or driver.
Step 1: Check the LED on the switch port.
TL-SG108E port LEDs show negotiated speed:
- Green = 1000 Mbps ✓
- Yellow/Amber = 10/100 Mbps ← this is what you have
Step 2: Access the switch web UI.
Connect a laptop directly to the switch (or any device on the same subnet as the switch’s management IP). Factory default is 192.168.0.1:
Browser: http://192.168.0.1
Login: admin / admin  (factory default)
Step 3: Fix the port speed.
Go to Switching → Port Config. Find the port your Nano is on. If Speed/Duplex is set to 100M Full or 100M Half, change it to Auto or 1000M Full. Click Apply.
The port re-links within a few seconds. LED turns green. iperf3 will now show ~940 Mbps.
“nvpmodel -m 2 doesn’t persist after reboot”
- JetPack can reset to a default lower power mode on reboot.
- Fix: add to
/etc/rc.local:/usr/bin/nvpmodel -m 2 /usr/bin/jetson_clocks
“Can’t SSH from nano-1 to nano-2”
- Did you set up inter-node SSH keys? Run
ssh-keygen -t ed25519on nano-1, thenssh-copy-id. - Check
cat ~/.ssh/authorized_keyson nano-2 to confirm nano-1’s key is present. - Verify
10.10.1.xaddresses are live on both nodes:ip addr show eth0.
My Cluster Layout
| Node | Hostname | IP | Specs |
|---|---|---|---|
| nano-1 | yuvrajsingh-jetson-nano1 | 10.10.1.1 | Orin Nano 8GB, MAXN_SUPER, fan connected |
| nano-2 | yuvrajsingh-jetson-nano2 | 10.10.1.2 | Orin Nano 8GB, MAXN_SUPER, fan connected |
| nano-3 | yuvrajsingh-jetson-nano3 | 10.10.1.3 | Orin Nano 8GB, MAXN_SUPER, fan connected |
Network: TP-Link TL-SG108E (gigabit switch), Cat 6–8 Ethernet, ports 1–3. Negotiating at 100 Mbps (r8168 driver quirk on L4T R36).
You’re ready. Build something.
Built for smolcluster. Distributed training and inference, from scratch, on your own hardware.
Final Checklist
- All 3 Nanos boot successfully
- Fan connected and spinning on each node
- JetPack R36 (Ubuntu 22.04) flashed on all 3 microSD cards
- OOB setup complete on all 3 Nanos (hostname, username, password)
- All Nanos reachable via ping (<2ms latency)
- Private subnet
10.10.1.xconfigured on all nodes - SSH keys set up from laptop to all Nanos
- Passwordless SSH works to all Nanos
- SSH config created on your laptop
- MAXN_SUPER mode active (
nvpmodel -m 2+jetson_clocks) - Python 3 and tools installed on all Nanos
- jtop installed and showing GPU/CPU readout
- Bandwidth test shows ~94 Mbps per link (disable Extend Mode if stuck at 9.5 Mbps)
- Temperatures stable at <65°C under full load with fan running
- nvpmodel + jetson_clocks added to
/etc/rc.localfor persistence
What’s Next?
You have a working 3-node Jetson Orin Nano cluster, each with CUDA 12.6, cuDNN, and TensorRT ready to go. Ideas:
- Distributed GPU inference: Split a model across nodes, or assign each node a batch partition. Ray Serve or a custom split-inference script.
- TensorRT optimization: Convert ONNX models to TensorRT engines on-device, 2–4× inference speedup over vanilla PyTorch.
- Distributed preprocessing: CUDA-accelerated ETL across 3 nodes in parallel.
- Edge monitoring: Run a quantized LLM locally across the cluster; this is what smolcluster is for.
Appendix A: Single Node Test Commands
These are the exact commands used to produce the single-node results in Step 11.
Baseline temperature
# Quick per-zone readout
for zone in cpu-thermal gpu-thermal; do
  idx=$(grep -rl "^${zone}$" /sys/class/thermal/thermal_zone*/type | grep -o '[0-9]*' | tail -1)
  temp=$(cat /sys/class/thermal/thermal_zone${idx}/temp)
  printf "%-20s %.1f°C\n" "$zone" "$(echo $temp | awk '{print $1/1000}')"
done

# Or live stream via tegrastats
sudo tegrastats --interval 1000
Single core stress (5 min) with live temp monitoring
# Terminal 1: run stress
stress-ng --cpu 1 --timeout 300s

# Terminal 2: watch CPU temp every 5s
watch -n 5 'cat /sys/class/thermal/thermal_zone0/temp | awk "{printf \"CPU: %.1f°C\n\", \$1/1000}"'
All 6 cores stress (5 min) with live temp monitoring
# Terminal 1
stress-ng --cpu 6 --timeout 300s

# Terminal 2
watch -n 5 'cat /sys/class/thermal/thermal_zone0/temp | awk "{printf \"CPU: %.1f°C\n\", \$1/1000}"'
Single node bandwidth (iperf3)
# On the server node
iperf3 -s

# On the client node
iperf3 -c <server-ip> -t 20 -f m
Single node GPU burn
# Build once
git clone https://github.com/wilicc/gpu-burn
cd gpu-burn && make

# Run (seconds as argument)
./gpu_burn 300
Appendix B: Cluster Test Commands
These are the exact commands used to produce all cluster-wide results in Steps 9 and 11.
All node pairs bandwidth (iperf3)
Start iperf3 server on each target node, then run client from another:
# Start servers on nano-1 and nano-2
ssh nano-1 "iperf3 -s -D"
ssh nano-2 "iperf3 -s -D"

# Test each pair individually (20s each)
iperf3 -c 10.10.1.1 -t 20 -f m   # nano-3 -> nano-1
iperf3 -c 10.10.1.2 -t 20 -f m   # nano-3 -> nano-2
ssh nano-1 "iperf3 -c 10.10.1.2 -t 20 -f m"  # nano-1 -> nano-2

# Two links from nano-3 simultaneously
iperf3 -c 10.10.1.1 -t 20 -f m &
iperf3 -c 10.10.1.2 -t 20 -f m &
wait
All-to-all bandwidth (all 3 nodes sending simultaneously)
# Start iperf3 servers on all 3 nodes
iperf3 -s -D
ssh nano-1 "iperf3 -s -D"
ssh nano-2 "iperf3 -s -D"
sleep 2

# Each node sends to a different node at the same time
ssh nano-1 "iperf3 -c 10.10.1.2 -t 20 -f m 2>&1 | tail -3" &
ssh nano-2 "iperf3 -c 10.10.1.3 -t 20 -f m 2>&1 | tail -3" &
iperf3 -c 10.10.1.1 -t 20 -f m 2>&1 | tail -3 &
wait
Latency matrix (all 6 directional pairs, concurrent)
ping -c 20 -q 10.10.1.1 2>&1 | tail -2 &   # nano-3 -> nano-1
ping -c 20 -q 10.10.1.2 2>&1 | tail -2 &   # nano-3 -> nano-2
ssh nano-1 "ping -c 20 -q 10.10.1.2 2>&1 | tail -2" &  # nano-1 -> nano-2
ssh nano-1 "ping -c 20 -q 10.10.1.3 2>&1 | tail -2" &  # nano-1 -> nano-3
ssh nano-2 "ping -c 20 -q 10.10.1.1 2>&1 | tail -2" &  # nano-2 -> nano-1
ssh nano-2 "ping -c 20 -q 10.10.1.3 2>&1 | tail -2" &  # nano-2 -> nano-3
wait
Full cluster CPU stress (18 cores, all 3 nodes)
Keep SSH sessions alive in the foreground so stress processes don’t die when the connection closes:
ssh nano-1 "stress-ng --cpu 6 --timeout 600s" &
ssh nano-2 "stress-ng --cpu 6 --timeout 600s" &
stress-ng --cpu 6 --timeout 600s &
wait
Monitor temps from each node while running (separate terminal):
watch -n 60 '
  echo "nano-1: $(ssh nano-1 "cat /sys/class/thermal/thermal_zone0/temp" | awk "{printf \"%.1f\", \$1/1000}")°C"
  echo "nano-2: $(ssh nano-2 "cat /sys/class/thermal/thermal_zone0/temp" | awk "{printf \"%.1f\", \$1/1000}")°C"
  echo "nano-3: $(cat /sys/class/thermal/thermal_zone0/temp | awk "{printf \"%.1f\", \$1/1000}")°C"
'
Full cluster GPU burn (all 3 nodes)
Build gpu-burn on one node and copy to the others:
# Build on nano-3
git clone https://github.com/wilicc/gpu-burn
cd gpu-burn && make

# Copy to other nodes
scp gpu_burn compare.fatbin nano-1:/tmp/
scp gpu_burn compare.fatbin nano-2:/tmp/

# Run on all 3 simultaneously (300 = seconds)
ssh nano-1 "cd /tmp && ./gpu_burn 300" &
ssh nano-2 "cd /tmp && ./gpu_burn 300" &
./gpu_burn 300 &
wait
Monitor GPU temps during the run:
watch -n 30 'sudo tegrastats --interval 100 | head -1'